“Learn to change the world” OR “Learn, to change the world.”

Image: http://harvardeducation.tumblr.com/post/97884586499/today-hgse-proudly-launches-our-campaign-underLast spring, I completed my Master’s degree at the Harvard Graduate School of Education (HGSE). As the next batch of new students will be starting classes in a few weeks, I’ve been thinking back to the school’s slogan: “Learn to Change the World.”

Seperately, I’ve been listening to the soundtrack to Hamilton. At one point, Hamilton’s sister-in-law receives a letter from him. In response to the greeting line of the letter, she sings, in reply:

It says: “My dearest Angelica,” with a comma after “dearest.” You’ve written, “My dearest, Angelica.”

Image: http://cdn.thewritepractice.com/wp-content/uploads/2011/08/the-oxford-comma.jpgCommas are important, obviously. This is certainly true of the HGSE slogan. The meaning changes, subtly, when a comma is added: “Learn, to change the world.”

In general, I’m a strong advocate of learning how to change the world–the “non-comma” version. I once created and co-taught a course called “Be the Change(maker)” for undergrads which explored exactly this topic. I’m a firm advocate of the idea that such skills can, in fact, be taught.

However, I’m also intrigued by the deeper implications of including a comma. Instead of learning how to change the world, this elevates the learning, itself, to be a radical act of change.

Learn to change the world.

Learn, to change the world.

If we really believed that the act of learning, itself, could be transformative and, in fact, world changing, what would schools look like?

Posted in Education, Higher education | Tagged , , , | Leave a comment

Education Cities’ “Education Equality Index” is a metric with problems

Education Cities has released a new report and interactive data on achievement gaps nationally. They have collected a large national data set and have created a new metric, which they are calling the Education Equality Index (EEI) in order to compare changes in achievement gaps in schools, cities, and states over time. Their calculations are based on pass-rates on state tests for students who are eligible for free or reduced lunch (FRL).

It is exciting that they are attempting to collect, organize, and interpret achievement gap data nationally, and the website provides great interactive graphics to dig into the data.

However, the EEI metric they have created is extremely problematic, to the extent of being nearly un-interpretable.

EC_Methodology_Graphics_v2-02

Strangely-triangular “normal” distribution from the methodology page

The methodology they released is a bit vague, but, essentially, to calculate a school’s EEI, they create a pseudo-school made up of just the school’s FRL students, calculate the performance of this pseudo-school as percentile compared to all of the other (real) schools in the state, and then do some adjustments. These school scores are combined to calculate city and state EEIs.


EEI doesn’t really measure equality or size of the achievement gap

Based on the information that has been released about their methodology, here are a few of the big concerns I have about the metric: things that are true about EEI, but that shouldn’t be true of any good measure of achievement gaps and academic equality.

  1. It is possible for two schools with identical EEI scores to have massively different internal achievement gaps.
    Assume that both schools enroll the same proportions of FRL students.Slide1
    At School A, the same percentage of FRL and non-FRL (say 70%) pass the state test–there is no gap.
    At School B, 70% of FRL students pass the test (just like School A), but, here, 100% of the non-FRL students pass–the gap is 30%. Slide2
    However, these two schools would have the same EEI score! EEI is publicized as a measure of equality (“Education Equality Index”), but a measure of equality is invalid if it gives the same rating to these two schools, which clearly have very different achievement gaps! 
  2. It is possible for the gap to be WIDENING in a school or small city, and yet that school or city shows improvement on the EEI. If a city’s non-FRL students increase by more than the FRL students, then the gap is widening, by definition. However, if the FRL students increased by more than other schools in the state, the EEI will improve. A metric publicized as being a measure of equality is not valid if it can improve when scores become less equal.
  3. A school or small city’s EEI (and the direction the EEI is moving–which supposedly indicates widening or shrinking achievement gaps) depends on arbitrary proficiency cut-scores.  Basing calculations on percentages of students who pass as opposed to students’ average scores has been well-documented to distort achievement gaps for several mathematical reasons. See this article, based on work by Andrew Ho, for more details.
    In addition to the problems described in that article, using such a metric as the raw data to construct the EEI leads to an unacceptable characteristic of EEI–that the EEI (and subsequent conclusions about existence of a gap, size of the gap, and change in the size of the gap) all depend not just on students’ actual test scores, but also depend on an arbitrarily chosen number, the cut-score. It is absurd that a school or city could be praised for closing an achievement gap (if the cut-score is set at 350), but that same school or city could be criticized for NOT closing the achievement gap (if the cut-score were to be set at 370)–even though the students’ actual test scores are identical in both situations. Whether or not an achievement gap exists is not dependant on an arbitrarily chosen number, so a metric that claims to quantify an achievement gap should not be, either. 

    Here are some more details about how that could happen (optional): 
    As a thought experiment, imagine a state’s cut-score was 0 points–anyone who writes their name passes. In this case 100% of non-FRL students would pass and 100% of FRL students would pass: there is no achievement gap. Now, assume the highest possible test score on the state test is 500 points and imagine that the cut-score was 501–so high that no one can pass. Since 0% of FRL and 0% of non-FRL students pass,  there is also no achievement gap. Now, assume all of student tests have already been graded and each student has a particular score. Now, it just remains to determine if they passed. Imagine slowly sliding a hypothetical cut score from 0 points (where everyone passes) to above 500 points (where no one passes). As you slide, the percentage of students who pass decreases for FRL and non-FRL students in the school or city AND at the state level. As these numbers change, each school’s EEI will go up and down in a complex way that depends on the score distributions of each of these groups of students at all schools across the state, the proportions of FRL students at each school, and the total number of students at each school. In some cases, there can be particular values of the cut-score at which a school’s EEI may be higher than last year’s EEI (indicating a shrinking achievement gap) and at other particular values of the cut-score the EEI may be lower than last year’s (indicating a widening achievement gap). A state’s choice of a cut score shouldn’t be able to determine whether or not an achievement gap exists!
    In Education Cities’ defense, they were basing their analysis on these kinds of scores (reported as “% who exceeded a cutoff”) since that is what they had access to from states, as they apparently didn’t have student-level data. While this is understandable, it makes the analysis susceptible to these problems.

EEI is impossible to interpret (and designed that way)

It is hard to tell from just looking at EEI what each point on EEI actually represents. Moving from an EEI of a 32 to 33 means what exactly?

Unfortunately, although this metric is quite abstract, Education Cities has chosen to scale it onto a range of 0 to 100, making it very easy to misinterpret as some kind of percentage (which it is isn’t) or some kind of percentile, which it only kind-of is.

This 100-based scale also makes lay readers assume that 100 is a perfect score, but 100 may not actually be achievable, in most cases. Additionally, any EEI of 100 (or near 100) indicates that FRL students are doing substantially better than their non-FRL peers, which is actually a very non-equal situation and one that a valid measure of “equality” shouldn’t favor.

However, because EEI is designed to be on this 0-100 scale, it makes it very easy for people to misinterpret EEI data. For example,  Chalkbeat TN:

While Memphis’ gap is larger than 70 percent of major U.S. cities, it narrowed the gap by a whopping 19 percent between 2011 and 2014, one of the fastest rates in the nation, the study says.

Narrowing the achievement gap by 19% is NOT a valid interpretation of an EEI change from 23.7 in 2011 to 28.3 in 2014. Yes, the EEI has increased by 19%, but EEI isn’t directly a measure of points of achievement gap decline. It would be correct to, instead, say something like:

An abstract metric that can’t be directly interpreted due to its design but that is somewhat related to how Memphis’ FRL students performed relative to all students in the state has increased by 19%.


Posted in data, Uncategorized | Tagged , , , , , , | Leave a comment

5×3=5+5+5

This image has been going around online for the past few days:

A student was asked to use the “repeated addition strategy” to evaluate 5×3. The student wrote 5+5+5 and got 15 as a final answer. However, points were taken off since the student was apparently supposed to write 3+3+3+3+3. A point was also taken off of the second question for a similar reason (the student made 6 rows of 4 marks, instead of 4 rows of 6).

Some people use this as a critique of Common Core, saying that any set of standards that leads to this must be flawed.

Other people have defended the teacher for various reasons including that the teacher is being intentional about teaching the techniques/thinking that will be most useful later on when students deal with operations that aren’t commutative (subtraction, division, matrix multiplication, etc.) or that “if the teacher has not covered the commutative property, then it might be unwise to let a student continue with this line of thought.”

Both groups of people are wrong.

First, teachers should never take points off for this. If I were the student whose work lost points in the image above, I would probably never forgive this teacher, and not take him or her seriously for the remainder of the school year, which is no one’s best interest. I assume I would not be alone in having that reaction. Similarly, the above argument that this would only be acceptable if the commutative property had already been explicitly taught is absurd. Punishing students for having (correct) mathematical insights that have not yet been taught is counterproductive.

However, just because a teacher should not have taken points off here doesn’t mean the Common Core is flawed. It is a GOOD thing that the Common Core encourages teachers and students to think about math using various mental models (here, thinking of multiplication as repeated addition or as an array). If you haven’t thought about it before, it is actually not immediately obvious why 5+5+5 should be equal to 3+3+3+3+3.

For people fluent in math, we interchange 3×5 and 5×3 automatically in our minds without thinking about it (this called commutative property). For people already fluent in math, it is still valuable to think deeply about why it is actually the case that 3 groups of 5 is actually equivalent to 5 groups 3.

For people not (yet) fluent in math, it is valuable to think deeply about why this actually the case so that this can be integrated into their understanding of math as they develop math fluency. Looking at 3×5 and 5×3 both as repeated addition and as arrays helps students to more deeply understand what is really going on here. The Common Core, like every good math teacher, WANTS kids to realize that these are all different representations of the same thing.

Here’s what could have happened, consistent with both Common Core and common sense.

Teacher asks four questions:  

  1. Evaluate 5×3 by repeatedly adding 5 the proper number of times.
  2. Evaluate 3×5 by repeatedly adding 3 the proper number of times.
  3. Compare your answers in 1 and 2. Notice anything surprising? Explain.
  4. Evaluate 4×7 by repeated addition in two different ways.

or

  1. Evaluate 5×3 by making an array with 5 rows.
  2. Evaluate 3×5 by making an array with 3 rows
  3. Compare your answers in 1 and 2. Notice anything surprising? Explain.
  4. Evaluate 4×7 by making an array in two different ways.

When the students later discuss division (or WAY later when they discuss matrix multiplication), there can then be separate deep conversations about why those operations are not commutative.

Posted in Education | Tagged , , , | 3 Comments

The “challenge zone” and group norms

You may be familiar with the following model of task challenge and learning:

Comfort Zone, Challenge Zone, Panic Zone

Comfort Zone: Tasks are easy and comfortable and pleasant–little learning occurs.

Challenge Zone: Tasks are complex enough to push the boundaries of one’s thinking and skills and maintain active engagement–lots of learning and growth occurs.

Panic Zone: Tasks are far beyond current abilities, anxiety and fear take over and people become overwhelmed and shut down–little learning occurs.

Students of educational psychology may recognize some parallels to the Zone of Proximal Development.

I’ve seen several other names for each of the three levels:
Comfort Zone Boredom Zone
Challenge Zone Risk Zone, Stretch Zone, Learning Zone
Panic Zone Chaos Zone, Danger Zone

I’m a fan of this Comfort/Challenge/Panic model and frequently use it as an internal check on the things I’m doing. When I’m in my Comfort Zone too often, I seek tasks that push me more. When I’m in my Panic Zone, I seek support (and learn to avoid what got me there in the first place).

I was recently in a the first meeting of a yearlong conversation about race and diversity at my university. To start off, the facilitator led a necessary, but otherwise un-noteworthy chat about group norms (well within my Comfort Zone).

Then, she presented the comfort/challenge/panic model of learning (cool, but still not really pushing my thinking).

Then, she guided a jump into my Challenge Zone!

She linked the norms conversation with the comfort/challenge/panic model:  “these group norms are what will keep us in the challenge zone as a group.”

Whoa. Mind blown.

Stretch Zone and Performance

If you want, you can think of learning as an example of “performance,” here.

We didn’t get to dig into this as the group, unfortunately (do we need a norm for when/how to “parking lot” ideas?), so I’d like to explore a bit more here, and get your thoughts.

The underlying theory seems to be that a group functions better and more learning occurs when people are in their Challenge Zones and that well-designed and well-implemented norms enable people to spend more time in their Challenge Zones.

This certainly seems plausible, but I have some more questions:

  1. Are well-designed and well-implemented norms necessary and sufficient to keep the group in its Challenge Zone?
  2. Is it necessary and sufficient for a group to be in its collective Challenge Zone in order to have optimal dialogue and optimal learning?
  3. How do personal Challenge Zones relate to group Challenge Zones? (Can a group be in its Challenge Zone while only some members are in their Challenge Zone? Is it possible for each of the group members to be in their own individual Challenge Zones, but the group as a whole is not?)

I’m curious to hear your thoughts on Q #1-3 above!

As an added twist, what happens if we replace “group” and “learning” with “team” and “performance?”

Posted in Education, Leadership | Tagged , , , , | 4 Comments

My Philosophy of Education

For one of my courses, students were asked to bring a quick summary of their philosophies of education. Here is (a slightly modified version of) what I wrote.

I have lots of opinions about education. I think most emerge from what is written below. This is a work in progress and I’d love be to able to tighten or focus this, as well as explore any aspects of my thinking about education that aren’t captured here. Please share your thoughts!

“Your curiosity is valid. Your frustration is valid.”

Education is what has happened when you can see the world more clearly and/or connect more deeply with a person, idea, or work of natural or human-created beauty. “You” can be an individual (of any age), or a collection of individuals, or an institution of any kind. Education usually happens informally (often entirely by chance) and can sometimes happen by design.

Education is most likely to be deep and lasting (and occur at all) when you, your peers, your authority figures, and the institutions you are attached to agree with the following two statements both explicitly, in frequently reinforced words and actions, and implicitly, in structures and values:

1: Your curiosity is valid.

image from https://i0.wp.com/web.stemiliescps.wa.edu.au/wp-content/uploads/2014/07/156799-o.jpgWhen it is perfectly obvious to you that you are capable of, permitted to, and encouraged to pursue the little or big things that intrigue you, you learn. When you are surrounded by (and coached by, and coach of) lots of other people who are empowered to pursue their curiosity, these people model deep engagement for you AND you learn about and can build off of all of things they are curious about.

2: Your frustration is valid.

It is normal to be frustrated by a wide variety of you-specific and general things, big and small. When you know that this is normal and that, in fact, you may even have frustrations in common with those around you, it is possible to stay engaged with those frustrations to explore ways to image from https://i0.wp.com/sparkimurs.com/images%202009/Quote%20Frustration%20M%20Scott%20Peck.jpgproductively address and work through those frustrations, and maybe even innovate a new solution to alleviate the frustrations of lots of other people!

Posted in Education, Leadership, Personal Experiences | Tagged , , , | 2 Comments

The chair rotates 360 degrees!

My 88-year-old grandmother recently got a new desk chair. It is a pretty typical chair.

After putting it together for her, I walked her through getting the back adjusted to the right level. We discussed how to use the lever on the side to move the seat up or down and how to push the lever inward to lock the back and prevent it from rocking.

There are wheels on the chair, but it was physically difficult for her to roll the chair while sitting in it, so we got it set up so that, when she wanted to sit down, she could turn the seat a quarter turn to the side, sit down, and rotate back towards the desk so her legs went under the desk. She practiced all of these skills (actually, we went through a pretty solid “I do–We do–You do”) and she got the hang of this new-chair technology pretty quickly.


My grandmother reads and underlines the direction manual for every item that she owns, regardless of how simple or straightforward I think the item actually is and regardless of the extent to which she already knows how to get the desired functionality from the item. True to form, she read the direction manual for the chair.

I got a call the next day:

“I was reading the directions…”

“Yes, grandma.”

“It says the chair rotates 360 degrees–all the way around! I tried it and it works! Did you know it did that?!”

“Uh, yes.”


Since then, she has mentioned to me at least one additional time how excited she is that the chair goes all the way around (“360 degrees!”).

Until she shared her excitement (repeatedly), it never crossed my mind that:

  1. It wasn’t perfectly obvious that the chair went all the way around. (Particularly since we had even practiced doing a quarter-turn).
  2. The fact that it went all the way around was exciting!


This provides a useful reminder for anyone seeking to “educate” someone else on a particular topic: a detail you may not even consider discussing since (you think) it is so obvious could lead to an insight that will bring great joy to one of your students!

Posted in Education | Leave a comment

How I think about conflicts

When thinking about most conflicts, large or small, I find myself mentally organizing people’s responses to the conflict into particular rungs within this ladder (a personal model adapted from the work of the Arbinger conflict ladderInstitute, Sustained Dialogue, and other sources)….

0. Anger.

My side is good, righteous, brave, wise, noble, thoughtful, moral, rational, etc.

The other side is cruel, evil, inhuman, immoral, irrational, ignorant, etc. and may be terrorists bent on the destruction of something I hold dear (literally in some situations, figuratively in others).

1. Acknowledgement.

I acknowledge that the other side may feel just as firmly about its beliefs on this issue as I do about my beliefs.

I don’t agree with the other side’s view, but I realize that this view exists and that the other side disagrees with me for reasons that IT thinks are valid (even if I don’t think those reasons are valid).

2. Respect.

I acknowledge that while they and I may have some fundamental disagreements on the issue at hand, I do, in fact, have some things in common with the people on the other side and may even agree with them on some (possibly small) aspects of the issue.

I believe that (at least most of) the people on the other side are good people, though I may disagree strongly with them.

3. Empathy.

While I firmly maintain my own identity and my beliefs that my own views on the issue are correct, I acknowledge that people on the other side may have different views that may also be correct, even if those views seem to be in conflict.

That there are legitimately pros to my side and cons to my opponents’ side does NOT imply that there are no pros to my opponents’ side nor does it imply that there are no cons to my side–my opponents may indeed be CORRECT about the pros to their side and the cons to my side.

It is always valuable to be intentional about exploring for the good on the other side.

bothSidesAreRight

4. Ubuntu/Heart at Peace.

This ladder rung is best defined by MLK, Nelson Mandela, and Anne Frank:

“When you rise to the level of love, of its great beauty and power, you seek only to defeat evil systems. Individuals who happen to be caught up in that system, you love, but you seek to defeat the system.” — MLK, Jr. (11/17/57).

“Darkness cannot drive out darkness, only light can do that. Hate cannot drive out hate, only love can do that.” — MLK, Jr.

“For to be free is not merely to cast off one’s chains, but to live in a way that respects and enhances the freedom of others.” — Nelson Mandela

“Our human compassion binds us the one to the other–not in pity or patronizingly, but as human beings who have learned how to turn our common suffering into hope for the future.” — Nelson Mandela


Some observations:

  • This ladder applies to conflicts on a wide spectrum of sizes: from small interpersonal disputes (with a neighbor, boss, family member, etc.) to major international conflicts and everything in between.
  • Moving up this ladder is much easier said than done; moving up this ladder is much easier for conflicts you can see from afar. Regardless, it is important to move up this ladder.
  • It may sometimes appear that gains can be made by your side by moving to lower levels of the ladder. It may indeed be correct that you can score short-term gains. However, every time you do this, you make it harder for yourself, others on your side, and (particularly) people on the other side to move up the ladder in the future.
  • Personally moving up the ladder does not require others on your side to also move to higher levels of the ladder and does not require others on the other side to also move to higher levels of the ladder. In the short-term, it may be unlikely for anyone else to do so, but in the long run, the higher you move on the ladder, the more possible it is for others on all sides to also move up the ladder.
  • Regardless of whether you initially care about the interests or lives of people on the other side, it is always in your own side’s (long term) self-interest to move higher up this ladder.
  • The longer aconflicthas been happening and the angrier the participants, the more likely the following:
    • Many people are at low levels on the ladder.
    • The conflict may only be resolvable in the long-term by moving towards the top of the ladder.
  • Most propaganda exists at level 0. In fact, a good test of whether you are sharing propaganda (on Facebook, for example), is if the item you are posting fits nicely at this level.
    • Sharing level 0 propaganda may indeed be helpful in the short-term (see the bullet above about short-term gains). However, it is not in your side’s best interest in the long-term (let alone the best interest of everyone else) as it puts downward pressure on everyone– pushing them towards low rungs of the ladder.
  • Adaptive Leadership is a powerful framework for thinking about how to empower people to move to levels 3 and 4 and how to push them to productively work to resolve the conflict once they are there.
  • Rungs 0 and 1 refer to the other side as “it.” Rungs 2, 3, 4 refer to people on the other side as “they.” This is intentional.
  • Most of this is written in terms of “my side” and “the other side.” In reality, in many conflicts there may be lots of sides (not just two). Moving higher up the ladder may help you see more of those sides.

Challenge

Think of some conflicts you are currently involved in or aware of. Think of some small scale interpersonal conflicts and think of some large scale political or international conflicts.

For each conflict you thought of, at what level of the ladder is your current thinking? Do you want to move to a different level? Why or why not?


Posted in Convopointer, Leadership, Political thought | Tagged , , , , , , , | 8 Comments

Intelligence Squared debates: voting data

Intelligence Squared US is a series of public debates on a wide variety of important, contentious topics.  A motion is proposed and two experts who support the motion debate two experts who oppose the motion. The debates take place in front of a live audience and are later broadcast on NPR, released as podcasts, and shared through other means.

Examples of past motions include: “Millennials Don’t Stand a Chance,” “Snowden Was Justified,” The Constitutional Right to Bear Arms has Outlived Its Usefulness,” “Affirmative Action on Campus Does More Harm Than Good,” etc.

Before the debate, the live audience is privately polled on their current support for the motion. After the debate, the audience is again polled. During both sets of votes, audience members can select “For,” “Against,” or “Undecided.” The side that has increased their share of the votes by the highest amount is declared the “winner” of the debate.

Consider, for example, this fictional debate:

BEFORE AFTER
FOR 31 42
AGAINST 44 49
UNDECIDED 25 9

In this debate, the side arguing FOR the motion would be declared the winner. The FOR side increased its votes by 9 percentage points (31 to 42) while the AGAINST side only increased its votes by 5 percentage points (from 44 to 49). Note that while FOR won the debate, they actually had a smaller percentage of total votes in the AFTER round of voting–it is the increase in votes that matters, not the total number.

Who won?

It is interesting to look at the data* from past debates to see how the voting changed during the course of the debate. For example, sometimes there is a very clear winner: in “More Clicks, Fewer Bricks: The Lecture Hall is Obsolete” (4-2-14), the FOR side increased by 26 points while the AGAINST side decreased by 12 points.

Sometimes, there is no clear winner: in the “Cutting the Pentagon’s Budget is a Gift to Our Enemies” debate (6-19-13), the FOR side increased by 7 percentage points and the AGAINST side increased by 8 points. However, it is important to note that the final tallies were actually 29% FOR and 65% AGAINST–quite far apart.

The winner of the BEFORE or AFTER vote could be very different than the winner of the debate (the side that increased more). Across all n=92 debates, the overall winner has only matched the winner of the initial vote 44.6% of the time. The overall winner has matched the winner of the final vote 73.9% of the time.

It actually makes sense that losing the initial vote may be an advantage: since the winner is determined by who increased their votes by the highest amount, starting with fewer votes than the other side provides more potential converts. If you start with 20% of the vote, that is 80% of the audience you can pull your increase from. If the other team started with 40% of the vote (thereby winning the first vote), they only have the remaining 60% of the audience to pull to their side. If you start with a smaller vote count, this also gives you fewer of your own voters to potentially lose in the final vote!

As you may have noticed, the tallies for FOR and AGAINST can both go up from the beginning to the end of the debate–and often do–due to the presence of UNDECIDED voters. A quick glance at the results shows that the number of undecided voters tends to go down substantially from before to after.

No more UNDECIDEDs?

The data certainly supports a major decrease in UNDECIDED voters. In every single one of the n=92 debates, the number of UNDECIDED voters does indeed decrease from the initial vote to the final vote. Across all of the initial votes, the median percentage of UNDECIDED voters is 30, while across all of the final votes, the median percentage of UNDECIDED voters has dropped to 8.

This is a noteworthy phenomenon. When spending an evening hearing thoughtful and well-articulated arguments for both sides of a motion, I can imagine two plausible scenarios:

  1. Audience members conclude that there are actually compelling and mutually valid reasons to favor BOTH sides of the argument and they gain a greater appreciation for the complexity and nuance of the issue and, unable to settle on a side, they vote UNDECIDED.
  2. Upon hearing good arguments on both sides of an issue, audience members weigh both sides and conclude that the slight (or not so slight) leaning they now have to one side of the issue must be sufficient to declare a side which they then vote for…. or some single argument happens to particularly resonate with them for whatever reason and they pick the side associated with that argument regardless of the rest of the debate.

I’ll set aside the philosophical question of which scenario is preferable in which situations, set aside the psychological question of the conditions under which people are more likely to choose one or the other, and set aside the political/sociological question of how to nudge people towards one scenario or the other and instead simply report what people actually did in this Intelligence Squared context.

Where did all of the UNDECIDEDs go? More data!

It certainly clear from the large decrease in UNDECIDED voters overall (30 percentage points initially to 8 at the end) that many people fall into scenario 2: they pick a side.

However, it is not yet clear what this actually looks like in practice…. Maybe most of the undecided people tend to flock to one side (presumably a “better” side that has won the debate). Alternatively, maybe the UNDECIDED people were simply uniformed and, upon learning more about the issue during the debate, will pick sides in the same proportion as the rest of the audience who had already previous picked a side.

Also, while it is clear that the total number of undecided voters is much lower, indicating that lots of the previously undecided voters picked a side by the end, what is not yet clear is if some people who previously had an opinion became undecided during the course of the debate and, if so, how many.

Finally, it seems reasonable that, when spending an evening hearing thoughtful and well-respected experts make carefully reasoned arguments on both sides of an issue,  at least some audience members would realize that they are, in fact, undecided about where they stand on that issue (or even on the wrong side entirely).  But is that actually the case?

Luckily, in addition to publishing the starting and ending “scores” for debates, Intelligence Squared has also published the breakdown of votes AFTER the debate grouped by audience members’ votes BEFORE the debate for n=26 recent debates. This allows us to see, for example, how many FOR voters stayed at FOR, switched to AGAINST, or switched to UNDECIDED.

For “More Clicks, Fewer Bricks: The Lecture Hall is Obsolete” (4-2-14), here is the data:

AFTER the debate
For Against Undecided
BEFORE the debate
For 12 7 1
Against 14 39 6
Undecided 13 5 3

The 14 above can be interpreted as “14 percent of the audience voted AGAINST the motion BEFORE the debate, but FOR the motion AFTER the debate.” The 5 can be interpreted as “5 percent of the audience was UNDECIDED on the motion BEFORE the debate, but voted AGAINST the motion AFTER the debate.”

Purple represents voters whose initial and final votes were the same (they didn’t change their minds at all). Orange represents voters who had an opinion to start with, but ended with the opposite opinion. Yellow represents voters who were initially UNDECIDED but ended up picking a side. Green represents voters who had an opinion to start with, but whose final vote was UNDECIDED.

Intuitively, you can also think about this in terms of rows or columns. The UNDECIDED row adds to 31: this means that in the initial vote, 31 percent of the audience was UNDECIDED. Among these 31 percent of the audience, in the final vote 13 of these percentage points voted FOR, 5 of these percentage points voted AGAINST and 3 of these percentage points voted UNDECIDED. Similarly, looking at the UNDECIDED column, for example, 10 percent of the audience was UNDECIDED in the AFTER vote, and 1, 6, and 3 percentage points out of these 10 had voted FOR, AGAINST, and UNDECIDED, respectively, in the BEFORE vote.

How did votes change from BEFORE to AFTER?

The table above only lists data for a single debate. Let’s look at trends across all n=26 debates for which full voting data is available. When looking at multiple debates, FOR and AGAINST are pretty arbitrary and depend on the wording/structure of the motion being debated. Thus, in the initial votes, I’ll combine FOR and AGAINST into the “had an opinion” bucket.

graph2

To get our bearings here:

  • 51 percentage points (purple) of the total audience had an opinion (FOR or AGAINST) in the BEFORE vote and voted in exactly the same way in the AFTER vote.
  • 14 percentage points (orange) had an opinion BEFORE, but switched their vote to the opposite AFTER. [Might these be strong partisans for a particular side who want their side to win–by having the biggest increase–and therefore vote for the opposite side initially and their own side in the final vote in order to maximize the increase in votes for the side they favor?….Or do they legitimately change their minds?]
  • 26 percentage points (yellow) were UNDECIDED BEFORE, but picked a side AFTER.
  • 4 percentage points (green) had voted either FOR or AGAINST in the BEFORE vote, but became UNDECIDED in the AFTER vote.
  • 5 percentage points (purple) were UNDECIDED in both votes.

Quick observations:

On average…..

  • Only 56% of the audience voted exactly the same BEFORE and AFTER!
  • Some people changed their mind! Among people who had picked a side in the BEFORE vote, 20% of these people voted for the opposite in the final vote and 6% became undecided.
  • The vast majority (84%) of people who were initially UNDECIDED ended up picking a side in the AFTER vote. However, those remaining 16% of the initially-UNDECIDED voters who stayed undecided made up 57% of the total number of UNDECIDEDs in the AFTER vote. Only 9% of the full audience was UNDECIDED in the AFTER vote.

But who exactly did the UNDECIDEDs all vote for?

For ease of comparison in a moment, let’s define people who have “picked a side” (P.A.S.) as those who voted either FOR or AGAINST (not UNDECIDED). We’ll look at the ratio of FOR/P.A.S: the proportion of FOR votes out of all FOR and AGAINST votes.

Considering the “yellow” voters who had been UNDECIDED, but eventually picked a side, how do their final votes compare to those of the rest of the audience? Let’s look at the proportion of these people who picked FOR in the AFTER vote (the FOR/P.A.S. ratio).

Which of the following do you think is most closely associated with the AFTER votes of these UNDECIDEDs?

  1. The BEFORE votes of the rest of the audience (FOR/P.A.S. in BEFORE vote). Maybe the population as a whole forms opinions on the issue in a certain proportion (equal to the proportion in the initial vote). Once audience members become informed about the issue through the debate, they’ll vote in a similar proportion as had people who had already been well enough informed to pick a side.
  2. The AFTER votes of the rest of the audience (FOR/P.A.S. in AFTER vote, among those who had picked a side initially). Based on the debate, maybe a certain percentage will vote FOR regardless of whether they were UNDECIDED to start with.

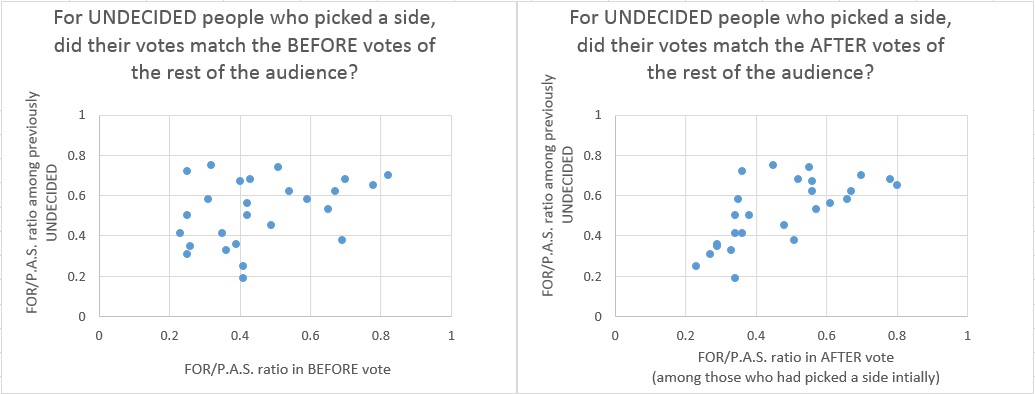
Here is the data on both of those possibilities:


          1                                                                           2graph3

A diagonal line (slope=1) would indicate that the proportion of UNDECIDEDs voting FOR in the AFTER vote exactly matched the proportion of FOR votes BEFORE (graph 1) and proportion of FOR votes AFTER (graph 2) among those who had picked a side.

A glance at the graphs shows that the AFTER vote of the UNDECIDEDs is more closely related to the AFTER vote of everyone else (graph 2) than it is to the BEFORE vote of everyone else (graph 1). The math backs this up. Doing a single-variable linear regression on each scenario, scenario 2 comes out ahead: bigger R^2 (.12 vs. .45), higher actual slope (.32 vs. .67), and lower p-value on the slopes (.09 vs. .00017).

Everyone else’s AFTER votes are a better predictor of the UNDECIDEDs’ votes than everyone else’s BEFORE votes! A possible explanation for this is that that the final vote by people who had previously picked a side is indeed related to the final vote of the previously-UNDECIDEDs, due to the substance of the debate.  It could also be partially due to the rest of the audience simply being more honest in their voting in the second vote (recall that people who come in strongly supporting one side have a strong incentive to lie in the BEFORE vote in order for their side to increase its share of votes by more in the AFTER vote). If there is some universal proportion of people voting FOR on a particular motion once they are fully informed, the (now-assumed-to-be-voting honestly) voters who picked a side initially are apparently more connected to the votes of the previously-UNDECIDEDs.

To sum up….

  • Most people who start with an opinion (FOR or AGAINST) end with the same opinion: 74%.
  • Most people who are initially UNDECIDED do pick a side: 84%. The side they pick is more closely related to the AFTER vote of the others than the BEFORE vote of the others.
  • A few people who start with an opinion actually change their minds during the debate: 20%. It is not clear how many of these people authentically change sides and how many are simply gaming the voting system to benefit a favored side. Conceivably, a voting system could be designed that can’t so easily be gamed, but such a system may have other downsides, and would almost certainly have the downside of being harder for the audience to understand than the current “winner= the side that increased more” system.
  • A few people who were UNDECIDED stay UNDECIDED: 16%.
  • A (very) few people who had an opinion to start with become UNDECIDED: 6%.

Apparently, hearing arguments on two sides of an issue (arguments that audience members perceive to be high-quality) leads most people to settle on an opinion, even when given the option be UNDECIDED. In this situation, where lots of focus in put on who will win (as in many other contexts), people could feel socially uncomfortable being UNDECIDED.

However, if an issue is complex and nuanced enough to be debated in this context, there certainly seems to be value in realizing through this process that you are, in fact, UNDECIDED. I wonder what would happen if a third pair of panelists was included in the debate: panelists who would argue for UNDECIDED–they “win” if the UNDECIDED vote increases by the greatest amount!

Do you agree that there is value in people being UNDECIDED? Do you have other ideas (in this context or elsewhere) for how to empower more people to be UNDECIDED?


*Here is the data. The first tab includes the BEFORE and AFTER voting data for all n=92 debates that have taken place as of today (7-27-14). The second tab includes data for the n=26 more recent debates for which complete data (the exact mappings from people’s BEFORE votes to FINAL votes) is available.

HT to Ian Simon for posing an initial question about the decrease in UNDECIDED voters in Intelligence Squared debates.

Posted in Convopointer | Tagged , , | 1 Comment

Service and Self-Efficacy

I recently had another post published on City Year’s internal IJ Blog! You need a City Year login to be able to view the original, so the full text is included below. Sorry that there is some City Year jargon in this essay! Here is a publicly accessible link to my previous essay published on the same City Year blog.

Service and Self-Efficacy

Near the mid-point of our year, I asked my team to make two lists: components of an ideal work environment (for us) and components of an ideal learning environment (for our students). Corps members made long lists in both categories. For example, for an ideal work environment, CMs [corps members] listed colleagues turning in work on time, doing things together outside of work, not distracting people who are working, having hour long lunch breaks, assuming good intent, asking if anyone needs support, and about 30 more items.  CMs did the same thing for an ideal learning environment, also generating a very long list.

Once everything was listed, we went back through each list and kept only the items that were actually within the power of the people in the room to realistically implement (the team, the TL [team leader], and the PM [program manager]). For example, we eliminated “hour long lunch break” since the school’s class schedule and our 50 Acts of Leadership Lunches make this impossible.

For items that remained, we organized the list and continue to refer back to it periodically during circles. Everyone privately selects an item to work on personally, and publicly selects an item for the group to work on.

This has been working very well—the team has been taking ownership over our own personal growth and over our own role in creating an ideal situation for ourselves and our students. People are surprised by how much of this is actually in our power!

However, what stands out to me about this activity is not the improvements that have already happened in the areas the group decided that we can control, but rather the volume of items the team eliminated from the list that they decided that they had no control over.

For an ideal learning environment for students, one of the items that had been voted down was “good teacher morale and positive attitude.” Certainly, corps members can’t directly control how the teachers feel about their work. However, I was disappointed that the team missed out on the pretty substantial indirect impact we can have on teacher morale, by being in the school, helping kids be personally and academically successful, and working to change the tone in the school—in fact, this is what City Year is designed to do!

People’s “self-efficacy” is the extent to which they personally believe they can accomplish something. There is psychological research that shows that a person’s lack of self-efficacy makes it less likely for them to actually accomplish their task. The CMs’ sense of self-efficacy didn’t include an ability to change the mindsets of those around them. There were also several other items eliminated as being out of our control that really shouldn’t have been. My fear is that this lack of self-efficacy actually prevents us from having the impact we aspire to have.

City Year’s very first PITW encourages us to “challenge cynicism—wherever [we] find it. […] Cynicism is the enemy of positive change because it discourages creative thinking—and destroys both the belief that change is possible and the will to act.” Challenging cynicism and developing one’s own sense of self-efficacy go hand in hand.

The conversation with my team indicated cynicism at several levels. The teachers’ (perceived) low morale indicates some cynicism on their part. The corps members’ belief that they had no power to impact the teachers’ morale indicates some cynicism on their part. At a deeper level, the teachers’ cynicism may be at least partially due to some cynicism on the part of their students: I’ve spoken with MANY students who think that school is just something that happens to them—they get in trouble, other kids bother them, they get scores and grades, etc. They have a very low sense of self-efficacy; they don’t realize that they have the ability to change anything around them or their own experience of school. City Year’s 50 Acts of Leadership, among other things, is designed to help them develop this skill: as they see the positive impact they can have on themselves and their environment, their level of self-efficacy increases, and they actually start to have more of a positive impact on themselves and their environment, continuing this cycle.

Seeing the positive outcomes of one’s work leads to an increased sense of self-efficacy and an increased sense of self-efficacy leads to more positive outcomes of one’s work.

A person’s own self-efficacy experiences peaks and valleys over time, certainly during the course of a year of a service! This is normal. However, one way to measure the success of a year of service (or a year of anything) is to look at the general trend in one’s own sense of self-efficacy. Do I perceive more self-efficacy at the end of the year than the beginning (in June, do I think I am able to get a larger amount of important work done than I thought I could have in August)? Does my team? Do the school staff? Most importantly, do the students?

Imagine placing yourself in a school in which the self-efficacy of students, teachers, and corps members is very low compared to a school in which it is very high. Where would you rather be? Where do you think the students would rather be? Working to increase self-efficacy probably isn’t sufficient to change the climate of a school on its own, but there is clearly value in developing a school-wide sense of self-efficacy, and an increase in self-efficacy usually signals that good things are happening in that environment. I’m skeptical of any apparent progress that isn’t accompanied by an increase in self-efficacy.

Having a clear vision for the future coupled with a powerful sense of self-efficacy and working to spread that to everyone around you has a name. It is called “idealism.” Within City Year, as we each venture forth on our own idealists’ journeys, be aware of your self-efficacy and the self-efficacy of others! I hope that by the end of the year, I’ll empower those around me to increase their own sense of self-efficacy.

If I ask my team at the end of the year to regenerate a list of components of an ideal work or learning environment, I hope they’ll eliminate fewer items as being out of our control. If I ask our partner teachers at the end of the year whether they feel they are able to positively impact the lives of their students and keep them on track to graduate successfully, I hope they’ll say “yes!” If I ask my students at the end of the year whether they feel like they have the ability to improve their grades, improve their relationships with peers and teachers, and positively impact the lives of those around them, I hope they’ll say “yes,” too! I hope the “BE” component of each person’s Flame of Idealism grows during the year to include a wider sense of self-efficacy! City Year can be a tool for developing this in everyone!​

Posted in CIty Year, Leadership, Personal Experiences | Tagged , , , , , | Leave a comment

To what extent are insights gained through introspection generalizable? (II-PT #1)

This is part 1 in a new series of posts titled Irresolvable Inter-Polar Tension, or “II-PT,” for short. The acronym conveniently looks like “two-part” and can be pronounced in that way.  F. Scott Fitzgerald once claimed that “the test of a first-rate intelligence is the ability to hold two opposing ideas in mind at the same time and still retain the ability to function.” This series seeks to develop this “first-rate intelligence” in us all by diving into pairs of conflicting ideas, the tension between which can’t easily be resolved.

As an educator and as a student, I often reflect on my own experiences as a learner. How did I learn best? What did teachers do that led to the deepest understanding and/or the greatest excitement for the subject? What kinds of assignments pushed me to improve my skill without boring me, without being too hard, without being too easy, without being too long, etc.? What did my teachers do to put me in situations in which I could work most constructively with my peers?

Similarly, as a leader and as a follower, I likewise reflect on my own prior experiences being led in different situations. What did a teacher/mentor/manager/leader do that particular inspired me? Helped me be most productive? Helped me be most eager to contribute? Helped me grow the most? Helped me have the biggest impact?

Thinking back on my own experiences, there are lots of examples of things that teachers/mentors/managers/leaders did or said that I responded very well to and also lots of examples of things they did or said that I did NOT respond very well to.

When I, myself, act as a teacher/mentor/manager/leader (or a colleague, partner, or friend), before doing anything, I strive to jump into the perspective of those who will be impacted and I work to optimize my words and actions so that people respond in the most desirable way.

I try to imagine how people might feel and adjust myself accordingly in order to create the best possible outcome based on my own introspection about how I would respond to a similar situation.

As a basic example, I remember as a young student being HIGHLY upset when my whole class would get scolded or punished for something that had absolutely nothing to do with me. I imagine that other people feel similarly, and I structure the things I do in order to not put others into this situation.

I tend to think this mindset is very useful. In practice, this active empathy works quite well. I often see cases in which problems are avoided with this strategy. I also see people get into difficult situations due to NOT using this strategy.

However, while this is clearly a valuable tool, what is not at all obvious to me is the extent to which I can assume that, put in the same situation, others would actually react the same way that I would.

To what extent are my own observations of my own reactions generalizable to others? What components of my own reactions are simply human nature, uncovered by my own introspection, (which can be generalized to others) and what components are simply unique to my own specific personality and experiences? What percentage of people might respond as I do?

There is certainly value in using introspection to explore my own reactions, assuming others will react in similar ways, and making decisions based on this. However, I am also very aware of situations in which I wasn’t able to predict people’s reactions correctly or they reacted in a way that hadn’t even occurred to me. It is not practical (or fair) to always assume a particular response.

There is certainly tension between the constructive use of introspection and the over-use of introspection. Finding the correct balance is an interesting and ongoing challenge!

Posted in Leadership, Personal Experiences | Tagged , , , , | 1 Comment